

The metrics and data shown in this report depend on how ticketing is configured for your account and whether tickets are connected to a helpdesk such as Zendesk or Freshdesk.
What this report answers
The Ticketing Report helps you answer questions such as:- How many tickets have been created?
- How many tickets are currently open or closed?
- How quickly are tickets being resolved?
- How many tickets are still waiting to be resolved?
- How old are the open tickets?
- Where are tickets being created from?
- Are ticket volumes or unresolved tickets increasing over time?
Volume metrics
Use the volume metrics to understand the overall number of tickets handled by your support team. Depending on your configuration, the report can show metrics such as:
Use these metrics together to compare incoming ticket volume with the number of tickets being resolved.
KPIs
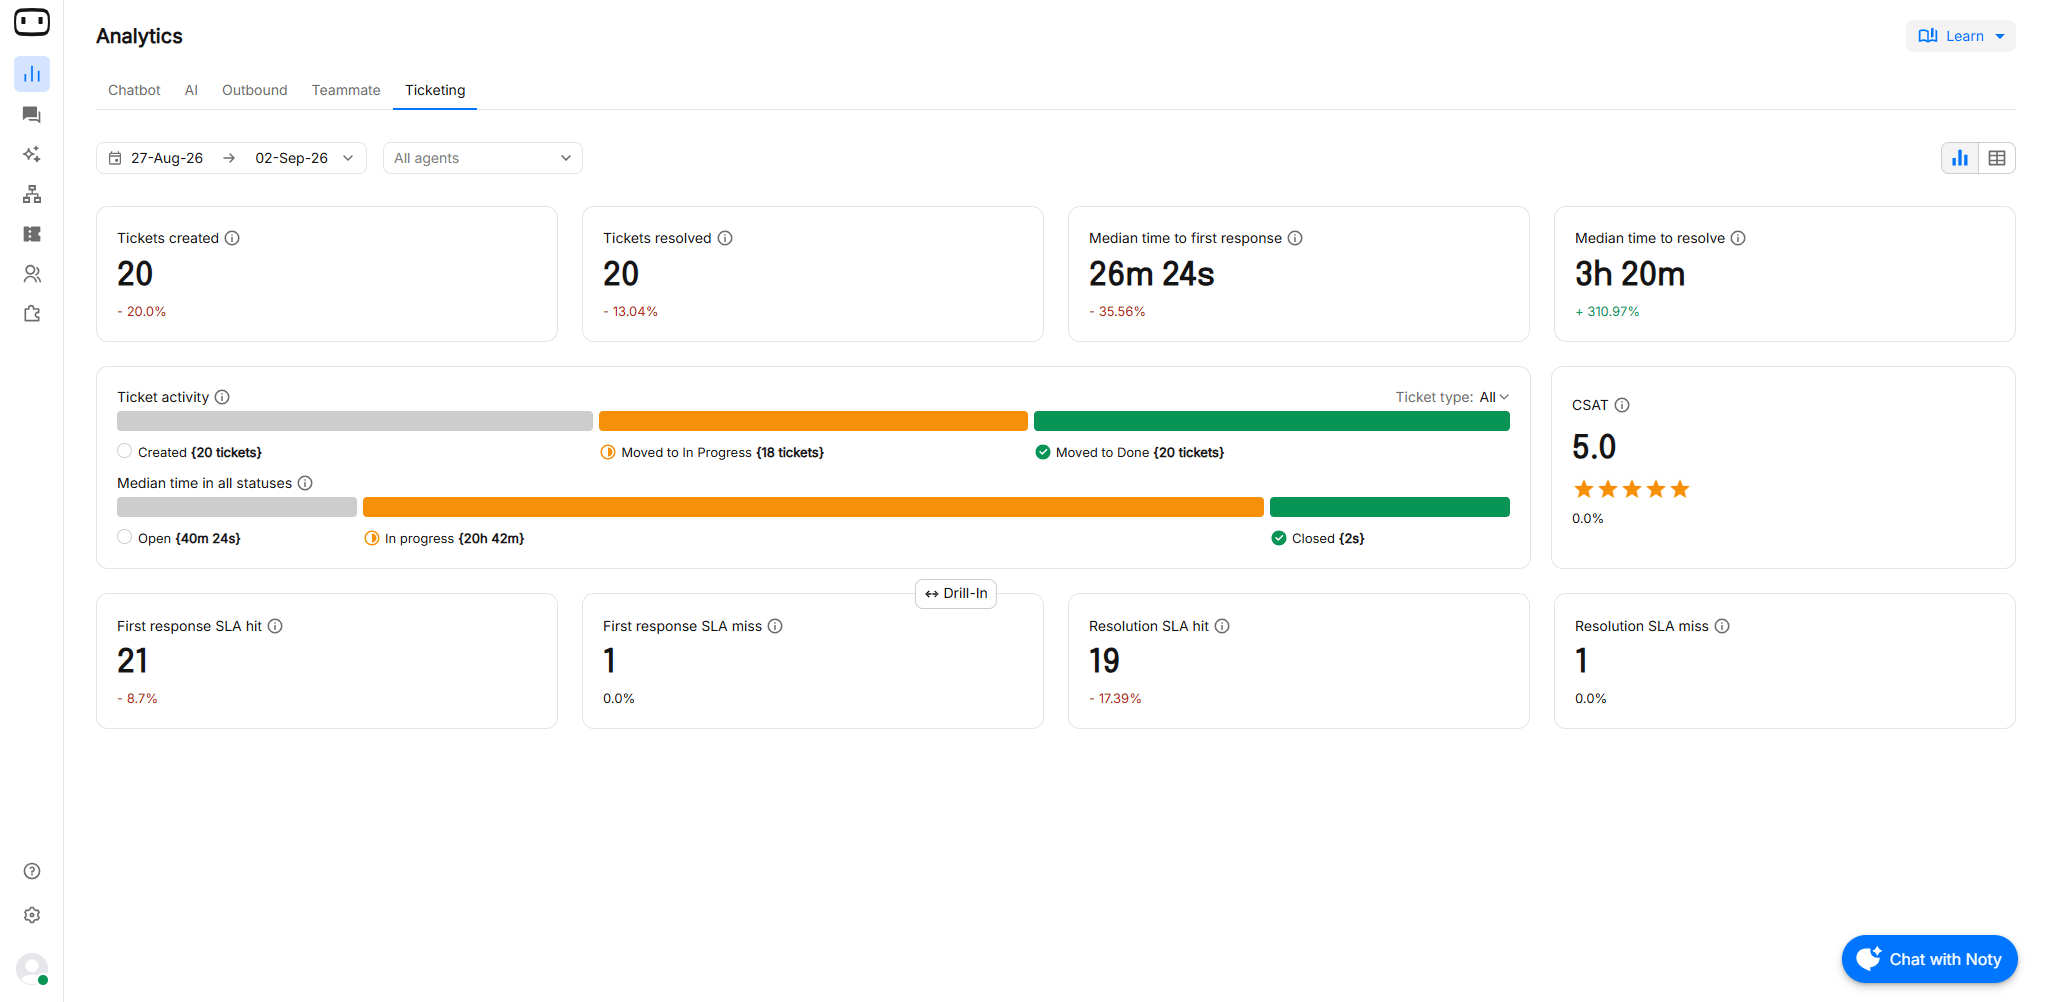
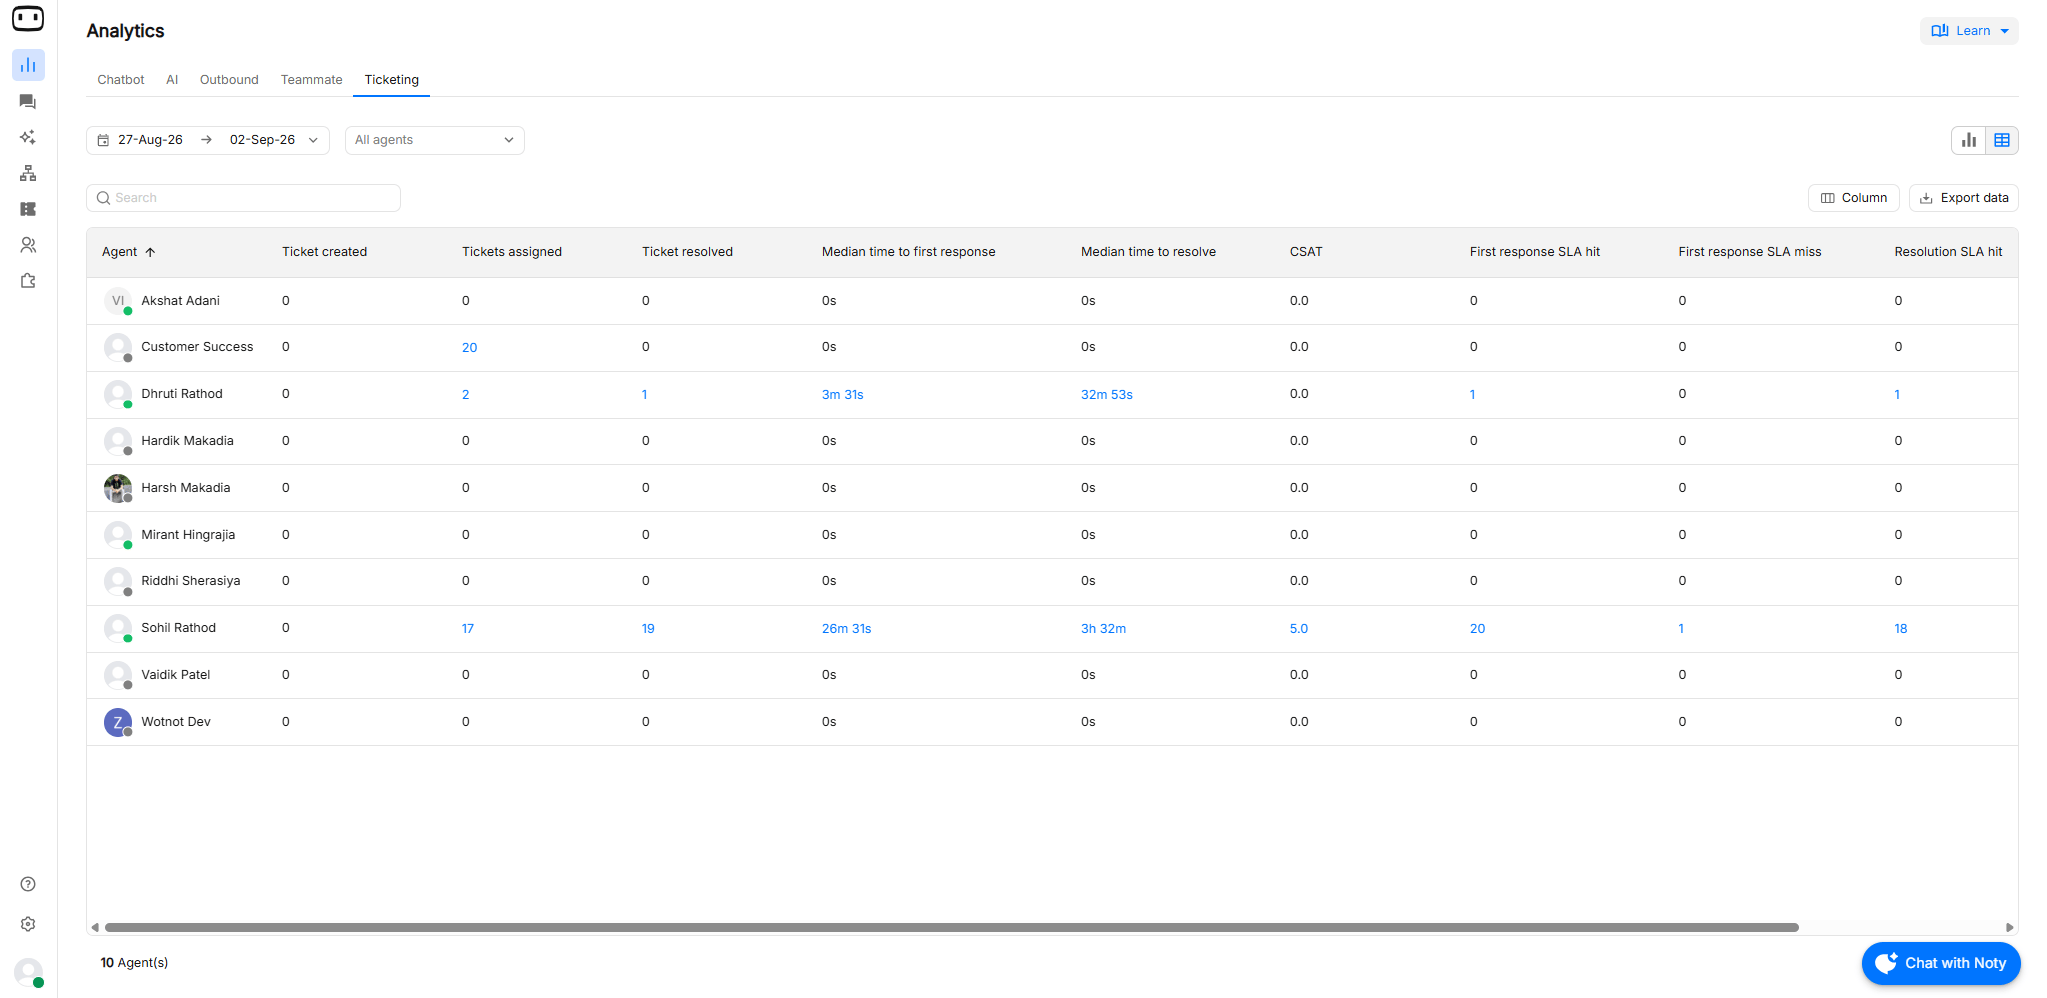
View KPIs related to your teammates performance when using the live chat feature to manually speak with your customers and users. This report displays all KPIs in two views:- Overview — i.e. high-level review of the performance.
- Teammate view — i.e. individual teammate overview.

Resolution metrics
Resolution metrics help you understand how quickly your team responds to and closes tickets.Time to first response
The time taken between ticket creation and the first response. This helps identify how quickly support teams begin working on newly created tickets.Time to resolution
The time taken between ticket creation and ticket closure. A lower resolution time generally indicates that tickets are being resolved more quickly, while a higher value may indicate complex issues, dependencies, or an overloaded support queue.First Response SLA hit
Total number of tickets where the first response was provided within the SLA time. This metric helps measure how consistently the support team meets its first-response commitments.Resolution SLA hit
Total number of tickets where the resolution was provided within the SLA time.CSAT
CSAT(Customer Satisfaction Score) measures how satisfied customers are with the support they received for their tickets. In a ticketing report, CSAT represents the satisfaction rating provided by customers after their ticket or support interaction. It helps support teams understand the quality of their customer service. Example: If a customer rates their support experience as 5 out of 5, it indicates a high level of satisfaction with the resolution and support provided.Ticket Activity
Shows the number of tickets that moved between different stages of the ticket lifecycle. You can also filter the data by Ticket Type. The filter provides four ticket type options, allowing you to view activity for a specific type of ticket. Account & BillingMedian time in all statuses
Shows the median time tickets spend in each status throughout their lifecycle. This helps you understand the typical amount of time it takes for tickets to move from one status to another. You can also use the Ticket Type filter to view the data for a specific type of ticket. Based on the selected filter, you can view the average time tickets spend in each status.Backlog metrics
The backlog section helps you identify tickets that still require attention.First Response SLA miss
Total number of tickets that breached the first response SLA time. This metric helps identify cases where the support team did not meet the first-response SLA.Resolution SLA miss
Total number of tickets that breached the resolution SLA time. Common reasons include:- The issue is complex and requires more time to resolve.
- The ticket is waiting for a customer response or additional information.
- The support team has a high ticket volume.
- The issue requires input from another team or department.
- The ticket was not addressed within the expected SLA timeframe.
Category breakdown
Use the category breakdown to understand what types of issues are generating the most tickets. Depending on the available ticket data, tickets may be grouped by:- Type
- Priority
- Label
- Category
- Source
- Root Cause
- Status
- Account ID
Reading the report
Suppose the report shows that ticket creation has increased while the number of closed tickets has remained relatively stable. This may indicate that the support backlog is growing. You can then compare:- Tickets created to understand incoming volume.
- Tickets closed to understand the team’s resolution output.
- Open tickets to understand the current backlog.
- Ticket age to identify tickets that have been waiting the longest.
- Resolution time to determine whether tickets are taking longer to close.
Filtering, drill-in, and export
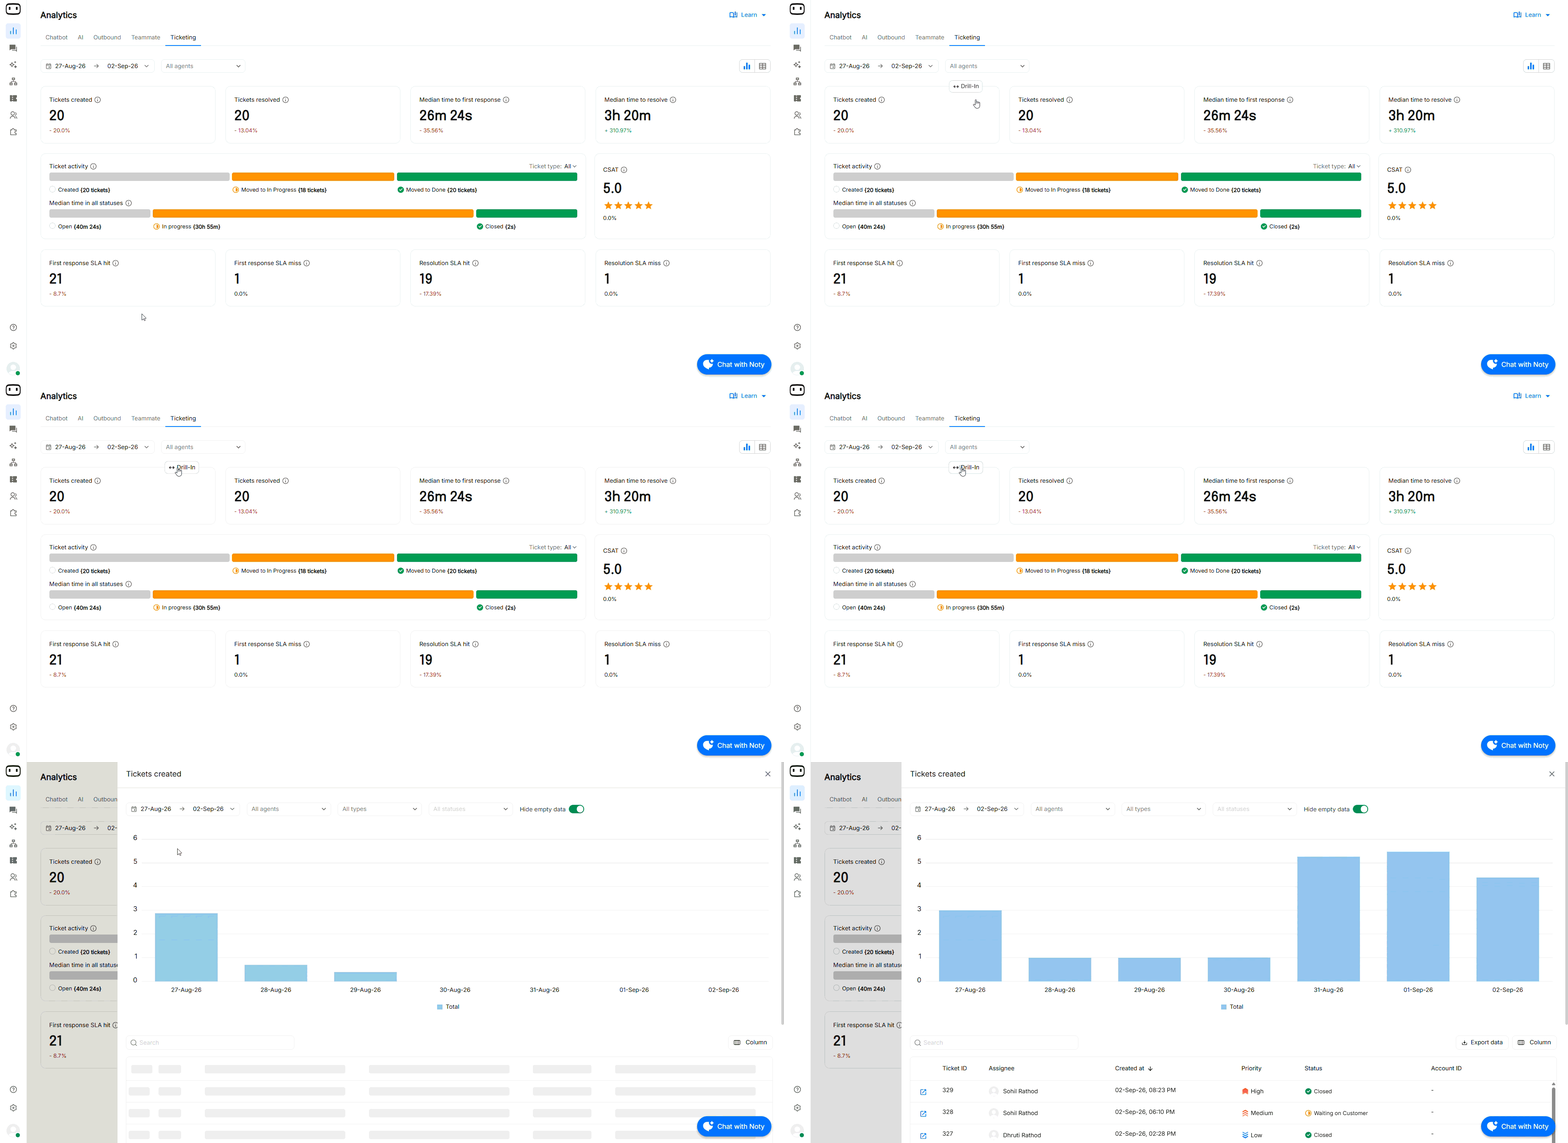
When you click Drill In on any KPI card (for example, Conversations, Leads, or Chat Started), you’re taken to a detailed view that breaks down how that metric was calculated. Once you drill in, you can:- View detailed charts See how the metric trends over time or across dimensions like webpage, chatbot, or date.
- Access raw data Explore the exact conversations or events that make up the KPI.
- Apply filters Narrow down data by date range, chatbot, webpage, channel, or other available filters.
- Export to CSV Download the filtered data as a CSV file for further analysis or reporting.
Reporting controls
Learn how to use date ranges, filters, drill-downs, and export options across WotNot reports.
Common confusions
Why don’t the numbers match my helpdesk report?
If your tickets are backed by a connected helpdesk such as Zendesk or Freshdesk, WotNot and the helpdesk may calculate or group ticket data differently. Differences can occur because the two systems may use different:- Reporting periods
- Ticket status definitions
- Resolution rules
- Response-time calculations
- Filters
- Data synchronisation timing
Is this report available without a helpdesk integration?
Ticketing reports are available without requiring a third-party helpdesk integration. If you are on the Custom plan, you can use WotNot’s built-in Ticketing Tool to manage tickets and access ticketing reports directly from WotNot.Which system should I use as the source of truth?
For helpdesk-backed tickets, use the system that owns the ticket lifecycle as the primary source for detailed ticket management. Use the WotNot Ticketing Report for understanding ticket activity associated with your WotNot conversations, and use the connected helpdesk for detailed ticket operations and its own native reporting.Related pages
Reporting Overview
Learn about the reports available in WotNot and the controls shared across reports.
Zendesk Integration
Connect Zendesk to manage and work with support tickets.
Zoho CRM Integration
The Zoho CRM integration allows you to create a new contact in your Zoho CRM account using information collected during a chatbot conversation.
Freshdesk Integration
Connect Freshdesk to manage and work with support tickets.