

The Chatbot report covers scripted chatbot flows. For performance and analytics related to AI Agents, see the AI report.
What this report answers
Use the Chatbot report to answer questions such as:- How many conversations is my chatbot handling?
- How many unique visitors are interacting with my chatbot?
- How satisfied are users with their chatbot interactions?
- How long do conversations typically last?
- How actively are visitors engaging with the chatbot?
- How many conversations are being abandoned?
- When are visitors most likely to interact with the chatbot?
- Which channels generate the most engagement?
- How are users progressing through the different steps of the chatbot?
- Where are users stopping or dropping off in a flow?
KPIs
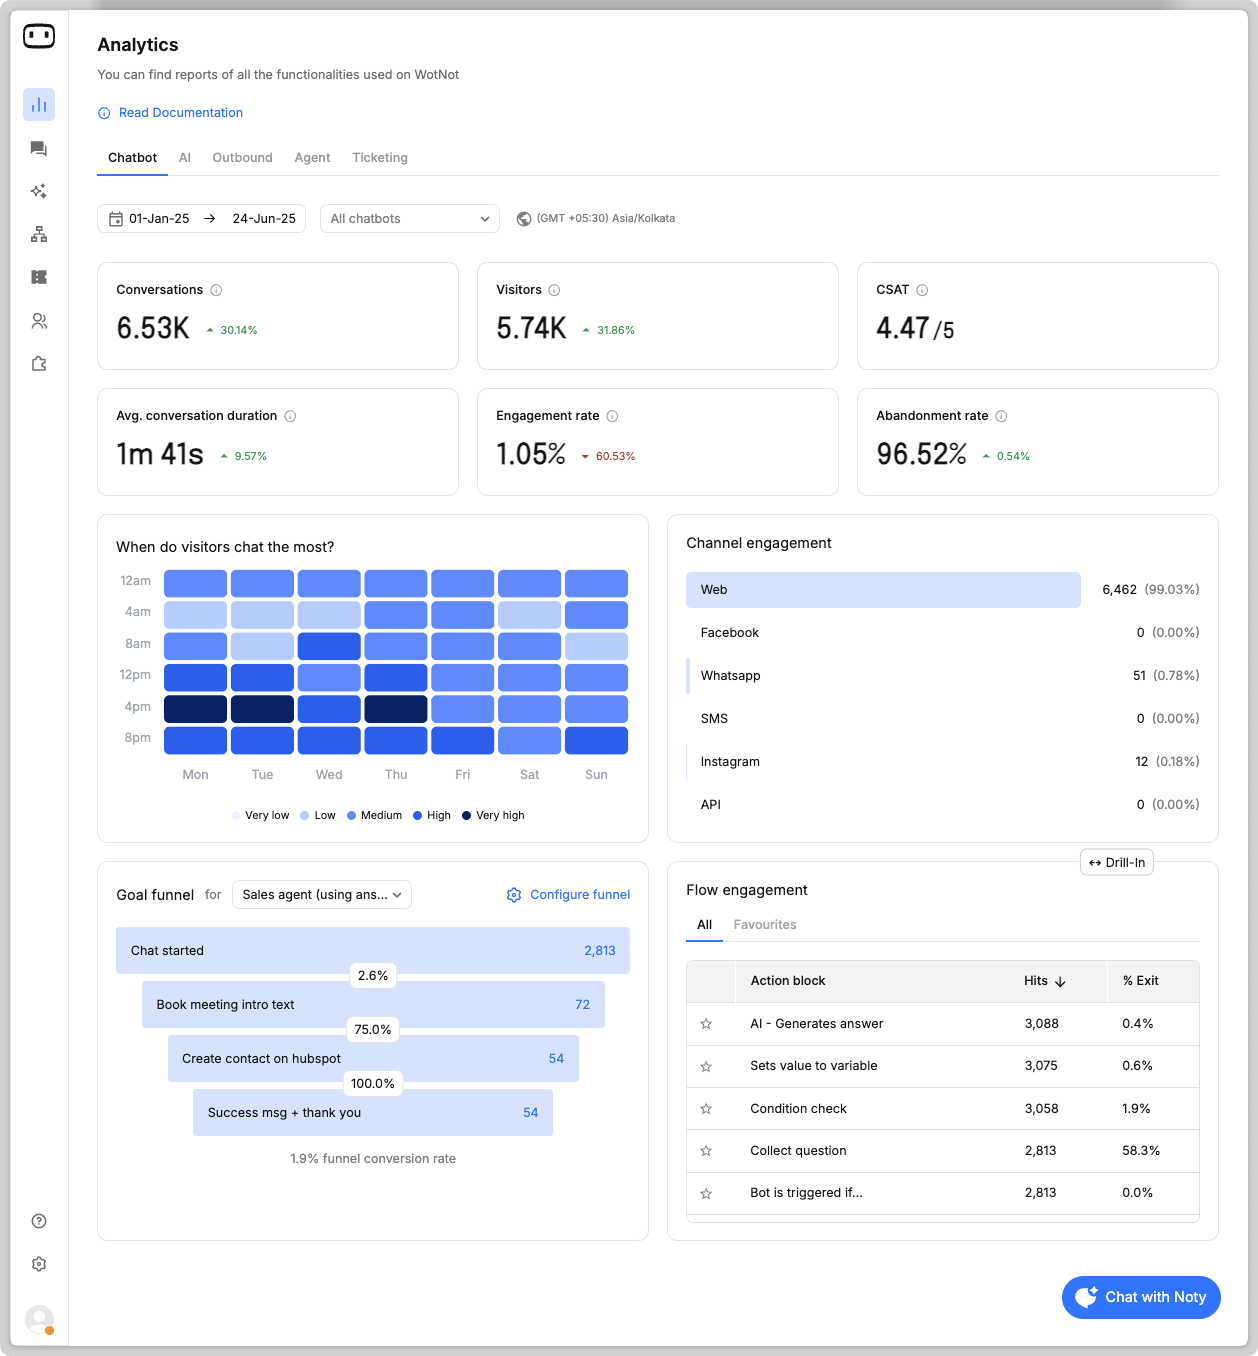
The Chatbot report provides insights into conversation volume, visitors, satisfaction, engagement, abandonment, visitor activity, channel engagement, and flow engagement.Conversation and visitor metrics
Conversations and Visitors represent different measures. A single visitor can have multiple conversations with your chatbot.
Satisfaction and engagement metrics
A high engagement rate indicates that visitors are actively interacting with your chatbot. A high abandonment rate may indicate that users are leaving the chatbot before completing their interaction.
Visitor activity
When do visitors chat the most
This section shows when visitors are most likely to interact with your chatbot. Use this information to identify peak days and times when chatbot usage is highest. This can help you understand visitor behavior and plan chatbot availability or support coverage accordingly.Channel engagement
The Channel engagement section shows where your chatbot conversations are coming from. It provides a breakdown of engagement across the channels where your chatbot is deployed, such as:- Website
- Other supported channels
Flow engagement
The Flow engagement section shows how users progress through the different steps of your chatbot. Flow engagement data can be displayed as a table containing the action blocks in the flow or as a flowchart showing the connections between blocks. Use Flow engagement to understand:- How many users reach each step of the chatbot.
- How users move from one block to another.
- Which blocks receive the most engagement.
- Where users stop progressing through the flow.
Reading the report
To identify what needs improvement, start with overall chatbot activity and then move into engagement and flow-level data. For example, suppose your chatbot has a high number of conversations but also has a high abandonment rate.- Check Conversations
A high number of conversations indicates that users are actively starting interactions with your chatbot. - Check Engagement rate
Review the engagement rate to understand whether visitors are actively interacting with the chatbot. - Check Abandonment rate
A high abandonment rate indicates that many conversations are being started but not finished. - Check Flow engagement
Review the Flow engagement data to identify where users stop progressing through the chatbot. - Review the relevant blocks
If users consistently stop at a particular block, review its message, options, conditions, or the next step in the flow. - Make improvements and monitor the results
Update the flow and continue monitoring the report to determine whether engagement improves and abandonment decreases.
Filtering, drill-in and export
Use the available report filters to narrow the data based on the dimensions available in the report, such as bots, flows, channels, and date ranges. Hover over a KPI and click the Drill-down button to view the detailed data behind the metric.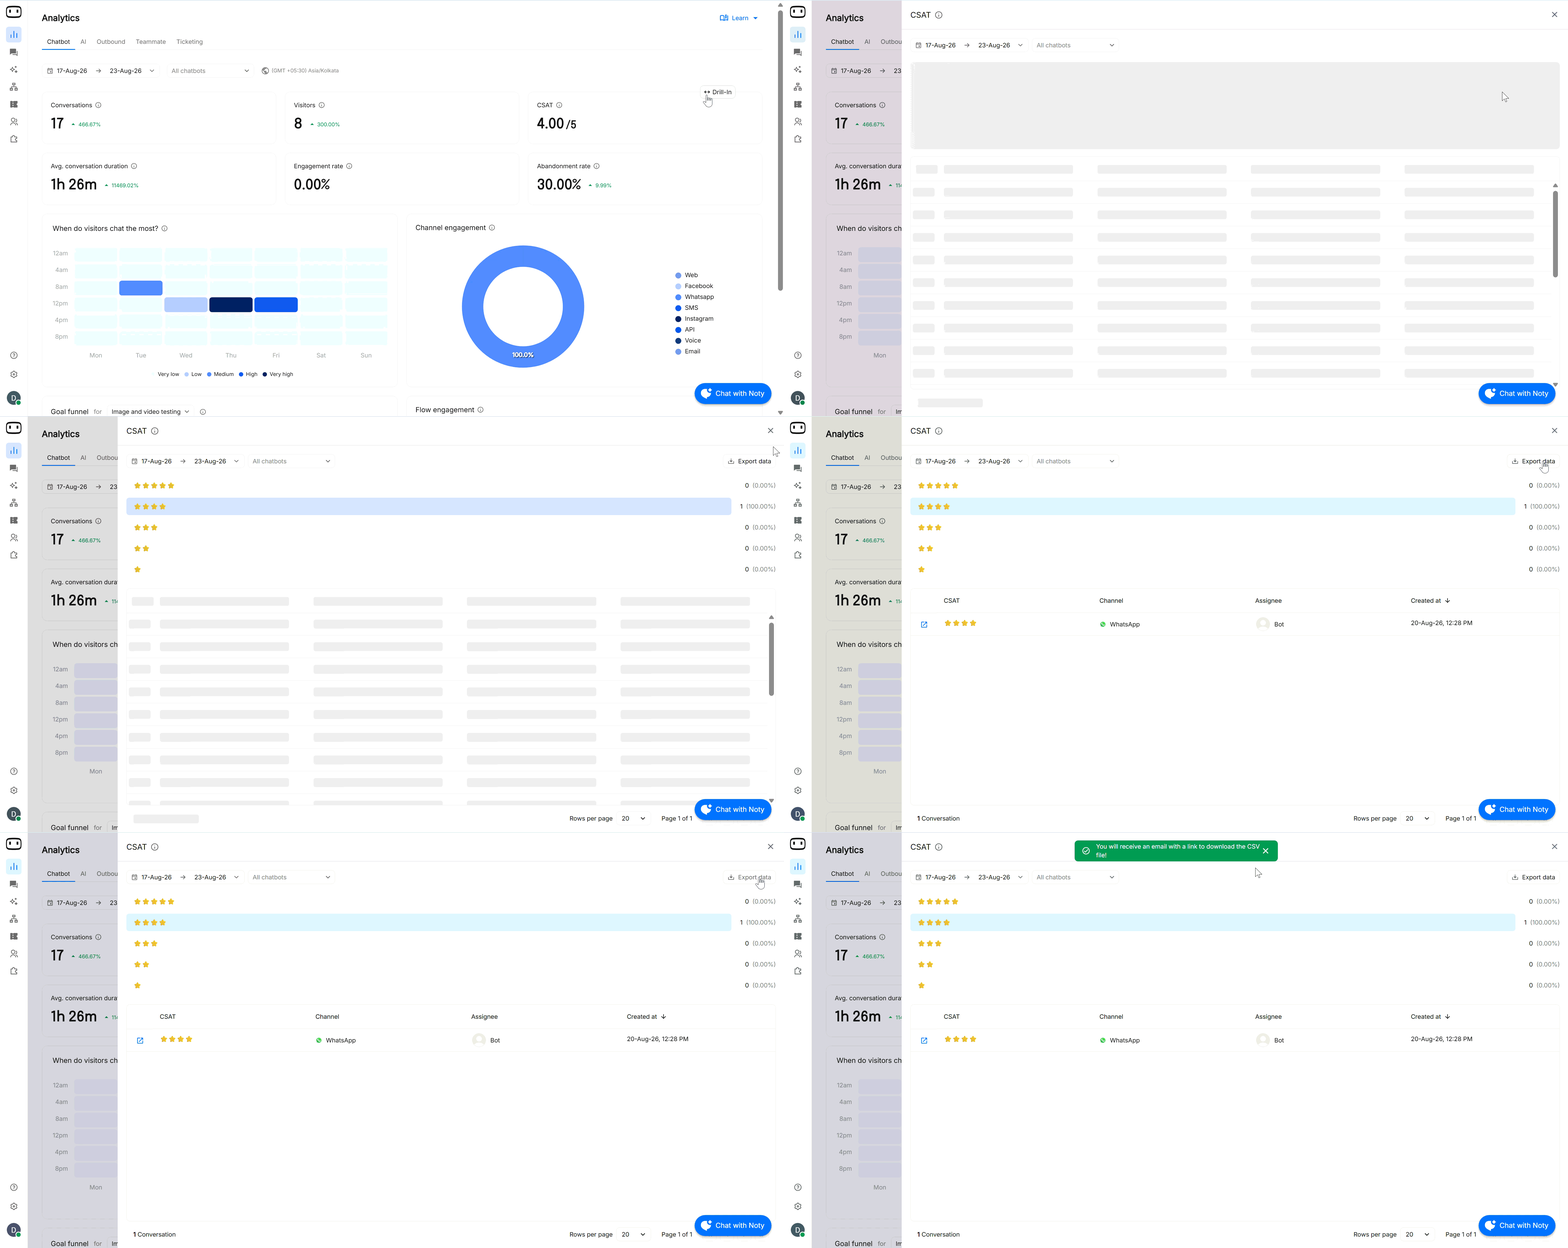
Common confusions
Why don't my Chatbot report figures match Live chat?
Why don't my Chatbot report figures match Live chat?
Reporting data may take some time to update after a conversation occurs. As a result, the figures in the Chatbot report may temporarily differ from the data shown in Live chat.
Why is the conversation count different from the visitor count?
Why is the conversation count different from the visitor count?
Conversations represent interactions handled by your chatbot, while Visitors represent unique individuals who interacted with it. One visitor can therefore have multiple conversations.
Why is my abandonment rate high?
Why is my abandonment rate high?
The abandonment rate shows the percentage of conversations that were started but not finished. A high abandonment rate may indicate that users are leaving the chatbot before completing their interaction. Review the Flow engagement section to identify where users are stopping.
What does the engagement rate show?
What does the engagement rate show?
The engagement rate shows the percentage of visitors who actively interact with the chatbot beyond simply opening it. It helps you understand how effectively your chatbot encourages visitors to engage.
What does Flow engagement show?
What does Flow engagement show?
Flow engagement shows how users progress through the different steps of your chatbot. You can use it to understand how users move between blocks and identify where they stop progressing.
Are test conversations included in the report?
Are test conversations included in the report?
No. Conversations created while testing your chatbot in the Bot Builder are treated as test conversations and are not included in the Chatbot report.